Track Endurance Cycling: Sports Science and Training Trends after Tokyo 2021.
INTRODUCTION
In December 2021, I wrote this article for the Shanghai Institute Sport. This blog article is the English draft. Below is the link to the Chinese Journal Article which was published in June 2023.
https://drive.google.com/file/d/139HRH6jQFdZnY9SdktQ-JIqL1DvLLEhE/view?usp=drivesdk
Track Endurance Cycling involves a hybrid of endurance, speed, power, technology and tactics. At the Olympic Games there are 3 events contested. Team Pursuit cycling with 3 cyclists for 4 kilometres and the Madison Race and Omnium Race which is 4 separate races on one day. In the world championships there are more events in Track Endurance plus the Individual 4 kilometre time trial for men and 3 kilometre for women. (1)
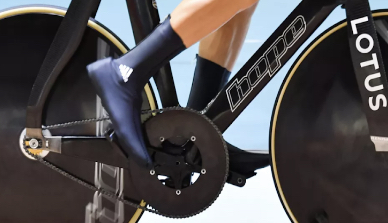
There is a huge amount of training information on the global internet about road cycling. But often specific training information on track cycling, and in particular track endurance cycling is less available. Countries develop new technology in secret. 20 years ago more research papers on specific training were available. One review for example was a summary of Germany’s program for the Sydney 2000 Olympics. (2) (3). Stadnyk used the term “secrecy” surrounding the dissemination of information via research (4). At the Olympic games the technology used in track cycling has to go to market, but the cost is high and often out of reach of the public. A recent internet article valued the Great Britain Lotus bike complete at £30,408 (262776 RMB).
NEEDS ANALYSIS
Examples of needs analysis in different sports are found in the research (5) (6). In Track Endurance Cycling there is a huge amount of data that can be accessed. Power, Heart Rate, Speed. The skills required and the tactics of each event also need to be taken into consideration. Added is the specific equipment from bike to outfit and how that all impacts performance and training due to aerodynamics. Then one needs to profile the athlete and do a comparative analysis with the demands and needs of the sport. I have added 3 videos in supplementary section.
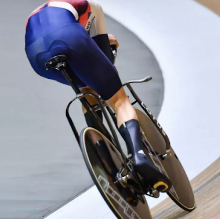
Team Pursuit cycling requires a static start. A regular change of racing positions occurs within the team during the race (the frequency varies between teams), and thereby a constant change in the aerodynamic drag on every rider. This was well described by Broker in a 1999 paper (7). It has been demonstrated in different investigations that the rider leading a pursuit team bears 100% of the power required to perform at a given speed, whereas the riders following benefit from the drafting effect, thereby reducing power requirements. A rider in position 2 performs at 70%, and riders in positions 3 and 4 cycle at about 64% of the power required for the actual racing speed. Thereby the challenge for a coach is to set a race strategy in such a way that the individuals contribute according to their capacities. Minimizing required power for a team or an individual in a team can contribute to a better performance. This is an area where significant research has been done. (8). Knowing individual aerodynamic characteristics of a group of different cyclists, the optimal arrangement regarding team efficiency can be estimated, resulting in time savings. At least as important is the determination of the individual power requirements, which then can be set against the potential capabilities of the cyclists.
FIGURE 2: Below are 3 graphs of power and speed output for the Team Pursuit event
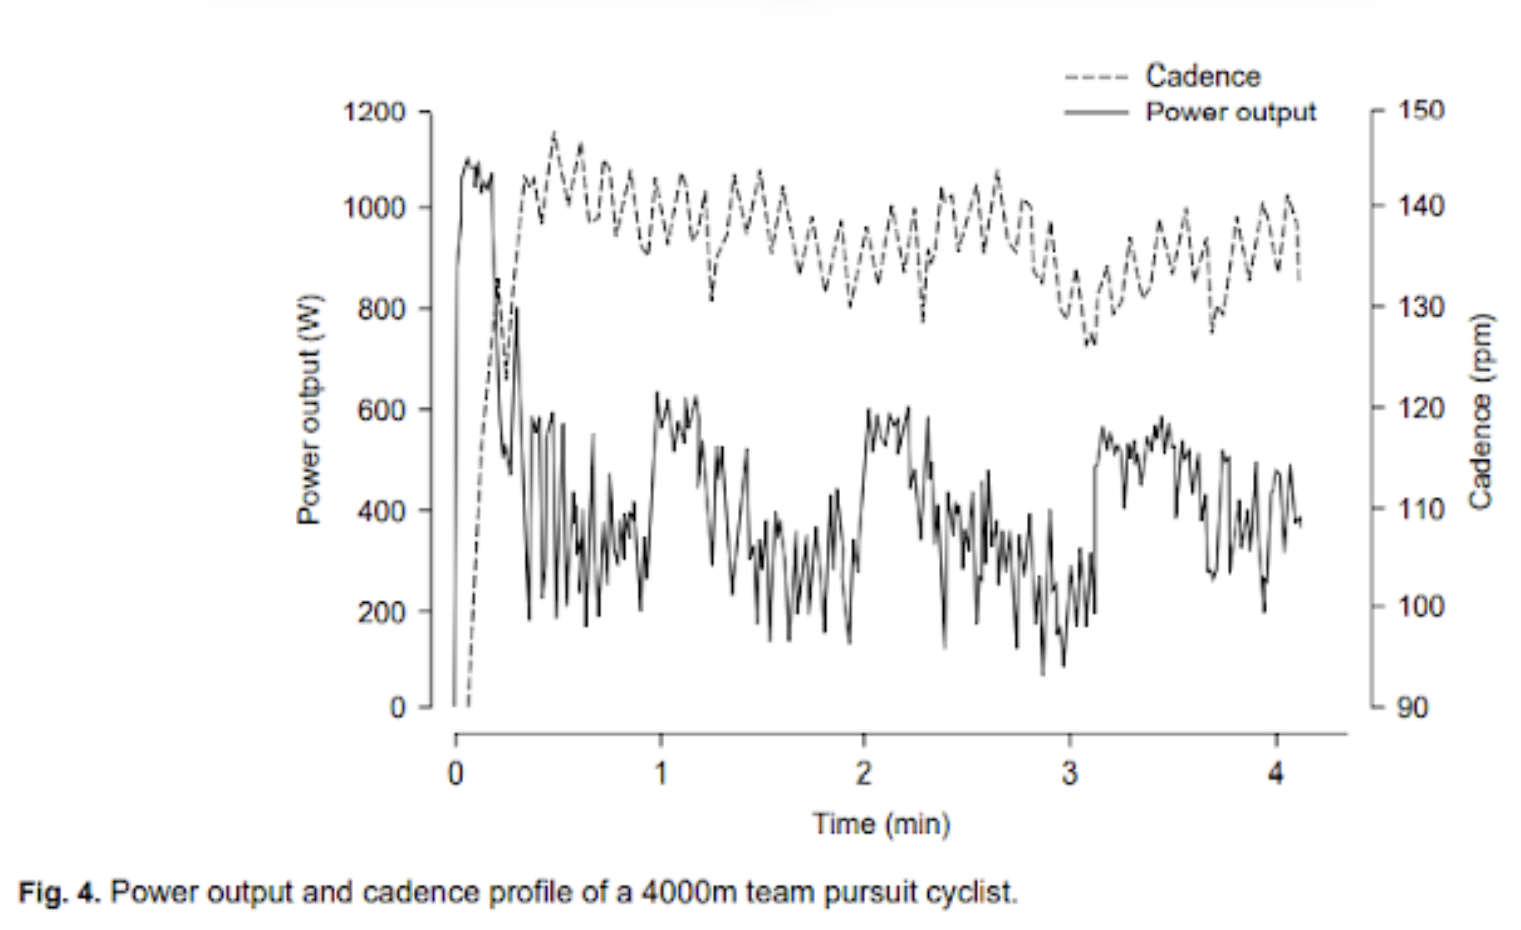
Graph (1) is from a 2001 World Cup Team Pursuit Race. The time was just over 4 minutes. Despite the world record being 3:42 now, 4 minutes is still a good time for many teams in 2021. So even in 2001, the event required power outputs were in excess of 1000 watts at the start. (Characteristics of Track Cycling: Sports Med 2001; 31 (7): 457-468. Norton and Craig.)
Graph (2) is a 3:56 Team Pursuit race from a UCI 2016 World Cup. This was for the third cyclist at the start. When he was leading, his power output was close to 700 watts. Average for the race was over 500 watts and the start for approximately 10 seconds was over 1000 watts. This time was close to the 2021 Chinese National Record. (Data from Strava Website for Harry Tanfield 2016 Team Pursuit Race. (Strava Pro Cyclist Profile | Harry Tanfield)
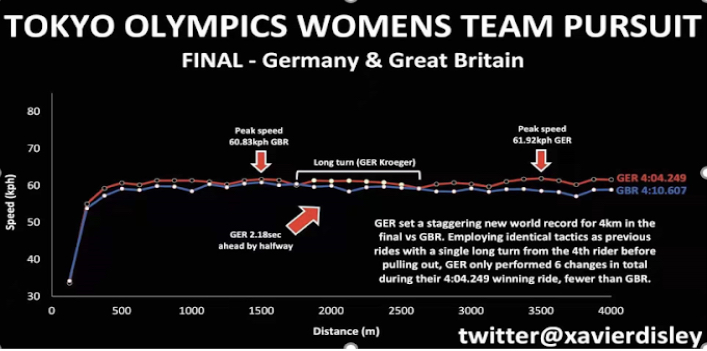
Graph (3) is a speed graph split into 30 second intervals. It is of the German Women’s team at the 2021 Tokyo Olympics. This graph highlights the female cyclist leaving the team at 2700 metres after several laps in front. She also started the race. So huge demands for her given she was number 1 at the start. Then spending a long time in front before leaving the team, impose huge demand on her energy. (Graph from B Xavier Disley, PhD (@xavierdisley) / Twitter. He is an aerodynamics expert.)
The tactics and strategies of how to maximize individual cyclists capabilities have been studied via mathematical modelling (9). In a paper published in 1998, Tim Olds established the relationship between the proximity of two cyclists and the VO2 savings gained by the trailing rider (10). (see graph below). He found that benefits of spacing can be as large as 14.1 per cent with a gap of 0.2 m and as low as 6.8 per cent with a gap of 2 m. Significant benefits occur as long as the gap between riders is less than 3 m. There were many crashes at the Tokyo 2021 Olympics Team Pursuit competition. One opinion was that teams were both trying to minimise space between wheels and also keep their heads down to minimise air resistance, contributing to crashes.
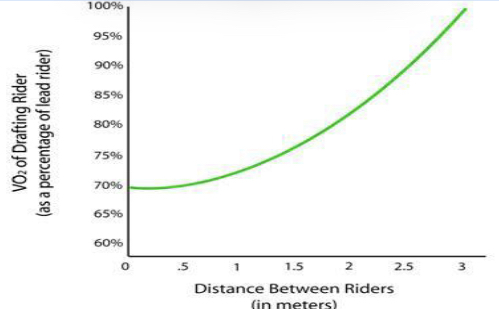
Graph from the “The Mathematics of Breaking Away and Chasing in Cycling. Tim Olds. European Journal of Applied Physiology, 1998”.
There has been a rapid improvement in the last 3 years in performances. Graph below is a record of race times since 2000 Olympic Games. Since 2004 the World Record has improved by 15.2 seconds. Half of that occurring in the past 3 years and a historically large improvement in 2021.
Figure 4
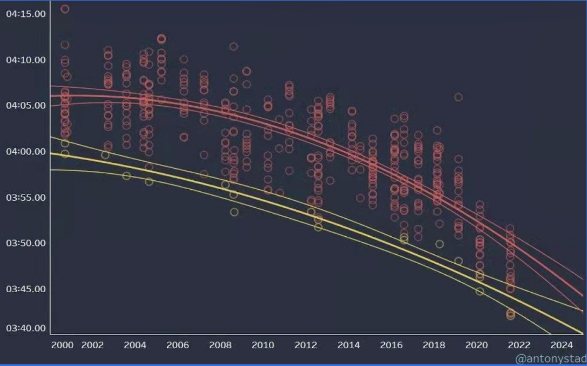
Graph from Antony Stadnyk (@antonystad) / Twitter. He is a cycling physiologist
A recent trend is to have less transitions and for cyclists to spend more time at the front. Also another tactic has been to employ an anaerobically gifted power cyclist to start early and shield the other cyclists from the intense requirements of the start. A 2017 study (11), “Qualitative Video Analysis of Track Cycling Team Pursuit in World-Class Athletes” concluded that longer transitions are related to poorer team performance expressed by a slower end time. 77 races in the 2017 study were analysed in the leadup to the RIO Olympics. The best time in this study was 238 seconds. In contrast the best 3 teams in Tokyo Olympics did 222 seconds. The New Zealand team of 2021 would overtake the 2016 New Zealand team twice! Elite teams are now attempting longer pulls and less transitions. The trend now is to use less transitions, to minimize the impact of time wasted at changes. Within 3 to 4 years tactics changed dramatically.
Developing cyclists and youth teams still may need to use smaller gears, higher cadence and in terms of team pursuit needs, develop skills for efficient transitions. There should be a long term progression in development of track endurance cyclists. Data from the IOC from the 1992 to 2012 Olympics showed the average age of medallists for Track Cycling was 26.2 and for road >28. (51)
The demands of Track Endurance competitions require performances at the highest intensity. This type of program is seen at other international events and domestic competitions. The ability to recover is critical. Below is the Tokyo 2020 Team Pursuit Schedule
TOKYO 2020 TEAM PURSUIT SCHEDULE
- Monday, August 2, 3.30pm – 6.30pm: Women’s Team Pursuit Qualifying/Men’s Team Pursuit Qualifying
- Tuesday, August 3, 3.30pm – 6.10pm: Women’s Team Pursuit First round/Men’s Team Pursuit First round/Women’s Team Pursuit Finals
- Wednesday, August 4, 7.00pm: Men’s Team Pursuit Finals
Richard et al in their review on Optimizing recovery to support multi-evening cycling competition performances, outline strategies that can be used to assist recovery between events and days of competition. Strategies are required to enhance recovery between races on Track Endurance competition schedules. Strategies are required for recovery and training must be designed to develop the ability to recover between events within a day (omnium) and from day to day. (12) (13).
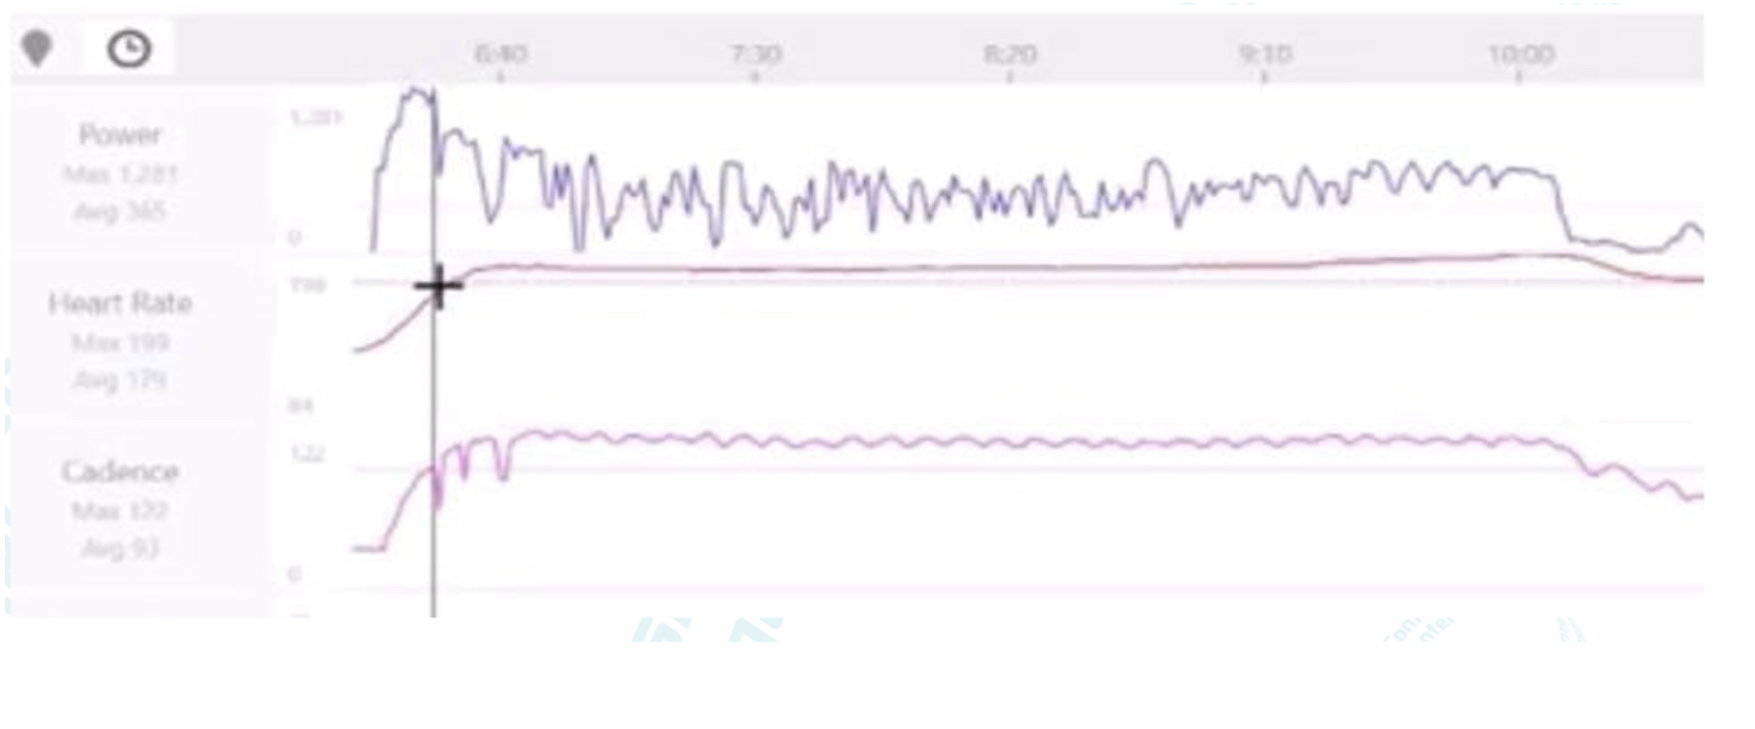
The different Track Endurance Events vary with their energy systems contributions. The Omnium is held on one day, with recovery periods between 4 races. Race 1 is the Scratch Race (10km men, 7.5km women. Next is the Tempo Race (same distances). The third race is the Elimination Race, which features sprints every two laps, and after each sprint the last rider across the line is eliminated. The race goes until just one rider remains. Examples of a power profile of the final event is the Points Race (25km men, 20km women) is shown below from a 2017 UCI race. Cyclists need to recover between events and be able to reproduce high intensity efforts and maximal sprints, 4 times in a day and intermittently in each race.
Distance 25km. Time 32.42. Normalised Power-348 watts. Average Power-290 watts. Max Power-1332 watts. Cadence (rpm) Ave 108/Max 147.
Figure (5). 66 kilograms track rider Felix English. He was riding the omnium at the 2017 UCI GP Favourite in Brno and claimed 3rd place. Cyclist Felix English Watts for UCI track podium ride (stickybottle.com)
The Madison is a relay race of two riders in which only one rider is “in the race” at any time. The men race for 200 laps (50km) while the women race 120 laps (30km). In Tokyo the men’s Madison did 50 kilometres in 50 minutes. This provides an insight into the demands of the race given maximal sprints interspersed with riding continuously for 50 kilometres.
The individual pursuits are 4 kilometre for men and 3 kilometre time trials for women. Huge power output is required at the start of these races. The cyclist has to accelerate smoothly with good technique to conserve energy. Recently in an internet article Ashton Lambie outlined his outputs in winning the World 4 kilometre championship in France 2021. He used 65×15 gears or 117″ gear (52) and averaged 14.8 second laps. The graph below on the left is the speed graph of Filippo Ganna world record of 4:02.647 in 2019. Below is Ashton Lambies power statistics from the 2021 World Championships. Totally different methods used by these cyclists.
Time: 4: 03.237
Average energy: 523w (7w / kg)
Maximum power: 1,115w (14.7w / kg)
First kilometre: 627w
Second kilometre: 507w
Third kilometre: 488w
Final kilometre: 446w
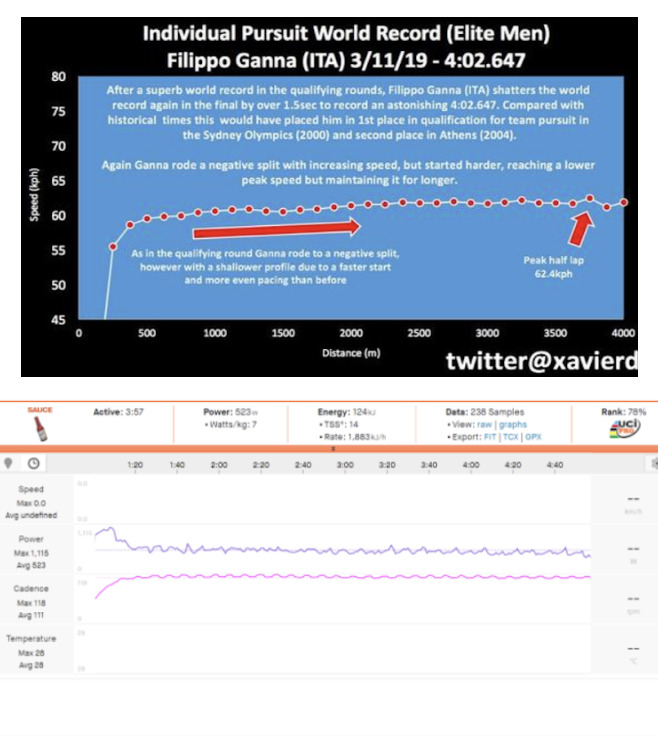
Graph 1: Graph 1 from B Xavier Disley, PhD (@xavierdisley) / Twitter.
Graph 2: Power analysis: Ashton Lambie’s worlds-winning individual pursuit – VeloNews.com
BIONERGETICS and TESTING
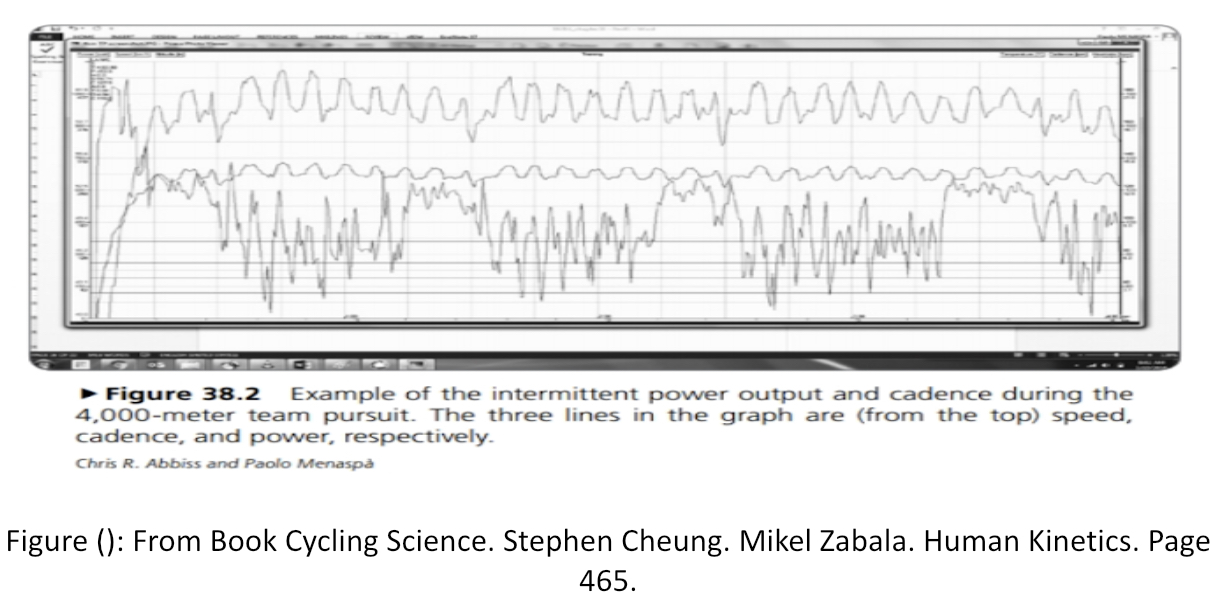
In 2001 in a review of Track Cycling, Norton proposed that in the 4000m individual pursuit, a contribution of 70 to 80% of energy from aerobic pathways and 20 to 30% from oxygen-independent sources was typical (3). When assessing a typical graph of a team pursuit graph below, cyclists spend a lot of time at or above maximum oxygen uptake. And apart from the Individual Pursuit races, the demands are intermittent. 20 year old studies from 2000 and 2001 reported instantaneous power outputs of 1000 to 1250 watts in the first 10 seconds. (3) (13). And reported power outputs fluctuating between 650 and 700 watts for the lead position and 350 to 400 watts when positioned behind the leader. Key sprints in the Omnium can be over 1000 watts (figure 5). In a 2016 World Cup Team Pursuit Race, the third cyclist was still reaching well over 1000 watts for the first 10 seconds and then nearly 700 watts when leading, and 500 watts average for the whole race. And this was a race that was 3:56 versus the world record now of 3:42 (figure 2, graph 2). In 2021, much greater power outputs are now achieved at speeds >65 km/hr.
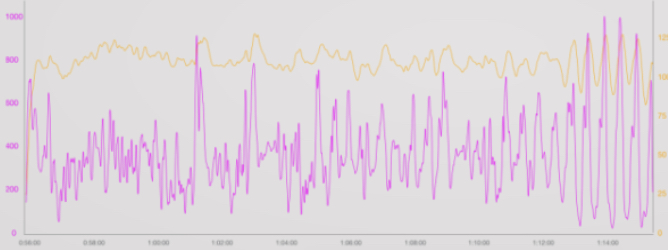
These power outputs are well above the athlete’s aerobic limits. This requires the use of the anaerobic energy pathways (ATP-PC and glycolysis). But given the intermittent nature of the events and the duration also, performance depends a lot on the cyclist’s aerobic capacity (41). The interplay of aerobic and anaerobic capacities is critical in track endurance cycling. There are other factors involved in track endurance cycling performance such as lactate kinetics, anaerobic threshold power, critical power and exercise economy. But it is important to recognize the intermittent nature of these events. Below a recent power curve of an elite team pursuit team represents this clearly.
Teams are now getting close to 1 minute for the first kilometre of a team pursuit race. The first cyclist is working at intensities that approximate 1 kilometre time trials. Anaerobic pathways (and neuromuscular power) are critical components of current track endurance cyclists and the initial estimates of 70/80% and 20/30% may not relate to current elite track endurance races, in particular team pursuit. (14). Recent research has highlighted the fact that a faster start during the first 10 to 15 seconds can increase VO2 kinetics immediately. This potentially decreases demands on anaerobic energy until later in the event. (18)
It is outside the scope of this review to analyse the methods of assessing the bioenergetics in sports such as cycling. Greater contributions of the anaerobic system can be expected than quoted in early studies (3). Now there are greater speeds, bigger gears and cyclists using weight training to improve power for endurance events. This magnifies the reason to simply maximize both aerobic and anaerobic systems for track endurance cycling.
Hawley et al (12) in a review on the bioenergetics of Track Endurance Cycling used the term “mystery events” when examining the bioenergetics of many of the track endurance cycling events. Given the need to tax the aerobic anaerobic pathways maximally in these events, they concur that aerobic and anaerobic capacities must be maximally developed through appropriate training.
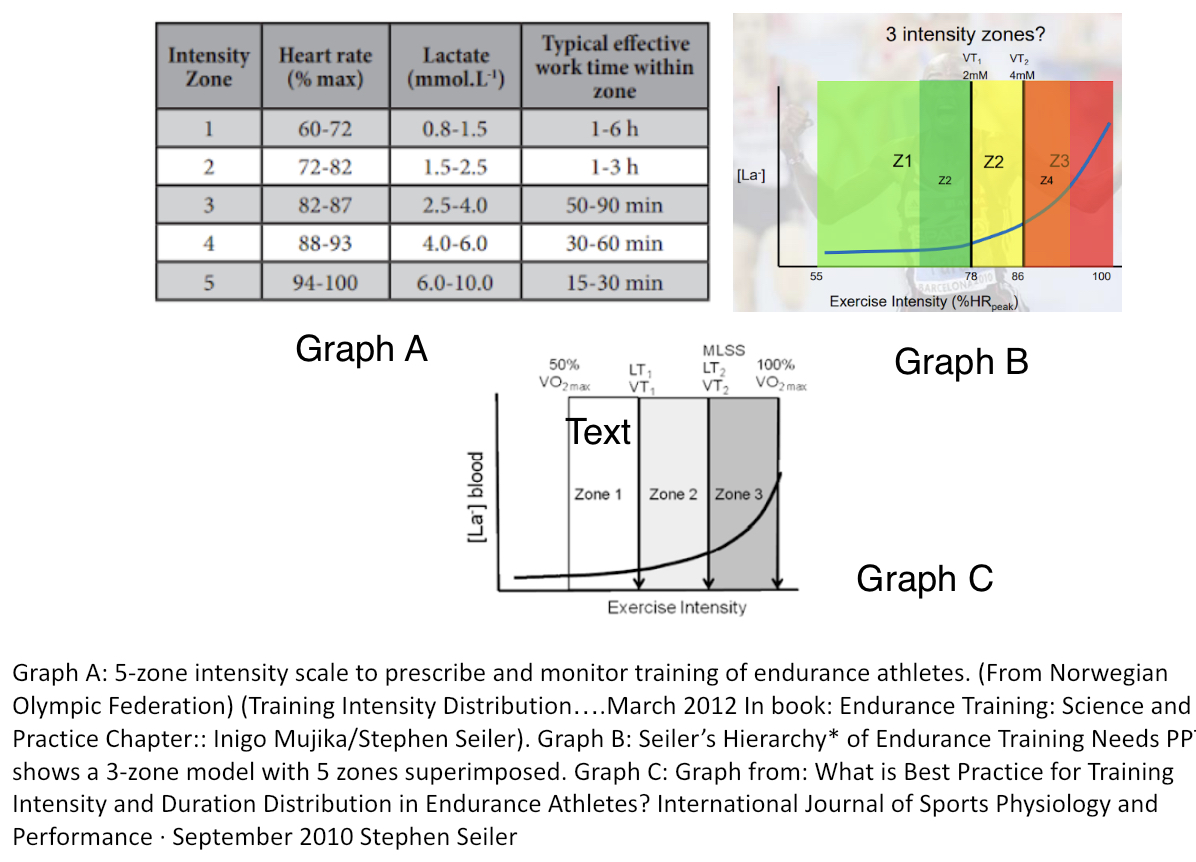
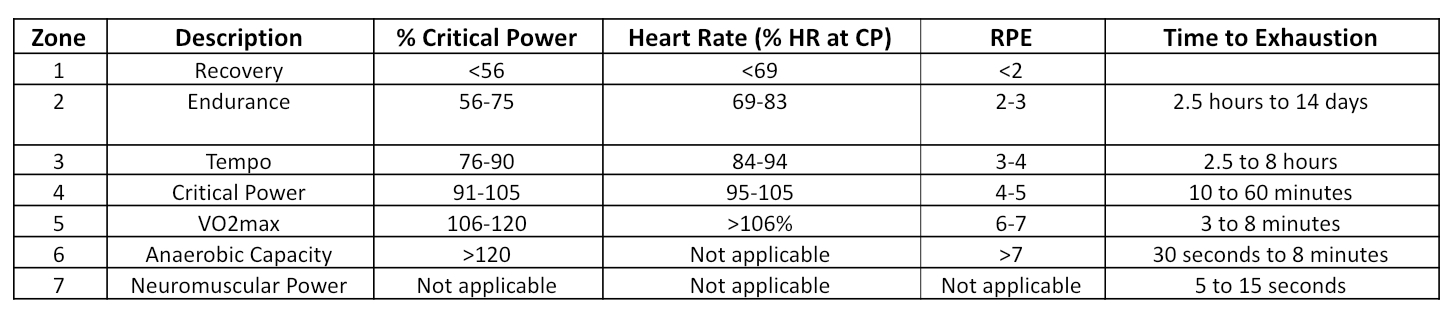
Testing to assess training zones and to prescribe specific exercise prescriptions for the individua cyclists is needed for a training program. The gold standard in the laboratory is the Maximum Oxygen Uptake Test. Here the 2 ventilatory thresholds can be estimated and also maximal aerobic power. And these ventilatory thresholds, are often of greater significance in Track Endurance Cycling than the Maximum Oxygen Uptake Scores (42). Added is the maximal heart rate and other information of power data at stages of the test. Zones can then be created to prescribe training. Below are 3 zone and 5 zone models used by the Norwegian Olympic Federation to quantify Training Intensity Distribution. Elite athletes generally use a 5-zone model to prescribe training, whilst sub elite use a 3 zone model. (Note research studies also use a 3 zone model).
In the field a simpler test has been developed to assess FTP or functional threshold power. The FTP test is therefore deemed representative of the uppermost power a highly trained athlete can maintain in a quasi-steady state for 60- min (16). But the test can be done for 20 minutes and 95% of the result is the FTP. Thus, zones can be developed through this method. FTP is supposed to correlate with the anaerobic threshold and is a simplified test. But research is now questioning its accuracy (17) given it is a performance metric and aligned to the 2MM and 4MM thresholds whereas in elite athletes, these thresholds values vary.
Jeffries et all in their paper recommend that laboratory-based assessments of B[La] parameters are used for the determination of Lactate Threshold, or that athletes are assessed using the power duration relationship, to derive a measure of Critical Power. (19) (20). Whatever the test protocol used, it is well established that there is a minimum maximum oxygen uptake a track endurance cyclist has to have. The aerobic system is the key foundation. But the Anaerobic Threshold often determines performance. The diagram below demonstrates how Anaerobic Threshold can change over the course of a season, whilst maxVO2 remains relatively constant. And it must be emphasized always that these energy systems interplay. They do not work in isolation.
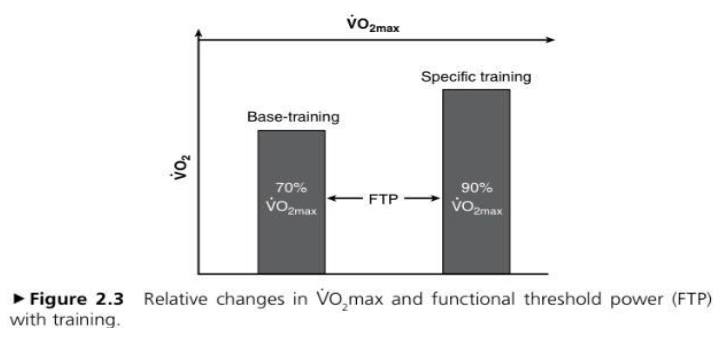
Figure (): From Allen and S.S Cheung. Cutting Edge Cycling. (Human Kinetics). 26.
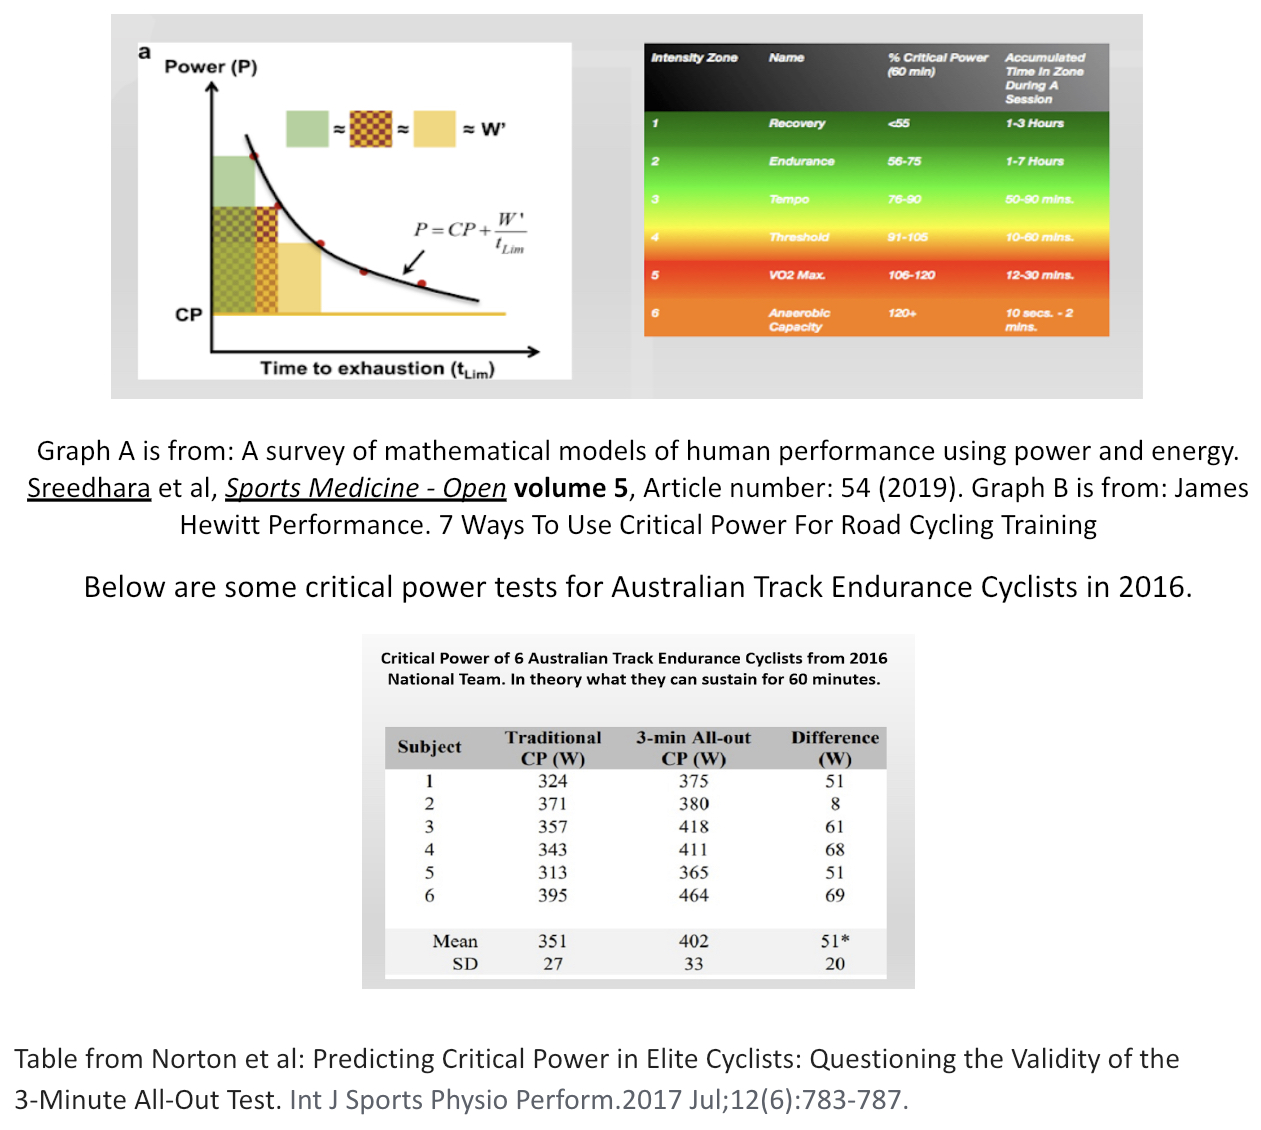
Mjulka et al 2021 study made the the following recommendations for Critical Power tests or a power-duration curve. A formal test protocol should include one sprint effort (i.e. ~ 10–15 s) and at least three maximum efforts between 2 and 15 min). These efforts can be completed in a single testing session, though it is recommended to divide field testing into two sessions over two consecutive days. Critical power is theoretically defined as the highest, continuously sustainable power output which a cyclist is capable of producing. In practice, people can typically only sustain power outputs at CP for around 30-minutes (43). The actual amount of energy available to a cyclist is important when riding at intensities above their critical power is termed the Anaerobic Work Capacity (AWC) or more recently known as W’ (W prime).
Feedback from one successful nation in Track Endurance Cycling provides a simple method of assessing cyclists. They use results from 4 kilometre time trials and 1 kilometre time trials to assess the capabilities of cyclists when selecting team pursuit teams. This particular nation has an aim to have male cyclists <4:20 for 4km and <1:03 for 1 kilometre. Whilst they still conduct tests such as laboratory tests and Critical Power tests to guide training, these simple norms provide a practical and realistic guide that translates to performance for them.
TRAINING METHODS
Polarized training is widely used in track endurance cycling training. (30) (32) (33). Polarized training involves doing a large volume of aerobic work, avoiding the middles zones of training, and then doing quality training at high intensity. This concept has been commercialized as 80/20 training. It is considered that too much training at moderate intensity (Zone 2 in a 3-zone model or Zone 3 in a 5-zone model) is fatiguing, but does not provide adequate fitness gains. For elite cyclists who train with high volumes, this can result in a cyclist who is then fatigued for subsequent high intensity sessions. These high intensity sessions are important because they drive specific adaptations. This extends to using Zone 6 for maximal anaerobic sprint interval training to improve capacity. And neuromuscular efforts (Zone 7) at maximal intensity of short duration, to build power and speed. Using Critical Power testing, the table below demonstrates how a cyclist could use the zones to apply the polarized training model. Depending on the testing protocol these zones can vary a little. For example if a cyclist uses the standard 20 minute FTP test they would use zones developed by Allen and Coogan (54).
Zone 2 in a 5 zone model (or Zone 1 in 3 zone model) is an aerobic zone where mitochondrial development in slow twitch fibres is maximized. Stephen Seiler comments in his paper (23): “Endurance athletes appear to self-organize toward a high-volume training approach with careful application of high-intensity training incorporated throughout the training cycle”. Type 1 Slow twitch fibres are targeted. When oxygen is plentiful (during lower or moderate intensity exercise), muscles derive energy through the aerobic energy pathway. During intense exercise, when glycolysis rates are very high, lactate accumulates. However, this lactate can be broken down for energy via the ‘lactate shuttle’ pathway. The body achieves this by transporting lactate from working muscles to regions of the body where oxygen levels are higher. This requires training protocols working above and under the anaerobic thresholds to enhance lactate kinetics (24). These sessions are often called under/over anaerobic threshold sessions. They are designed to improvement lactate clearance.
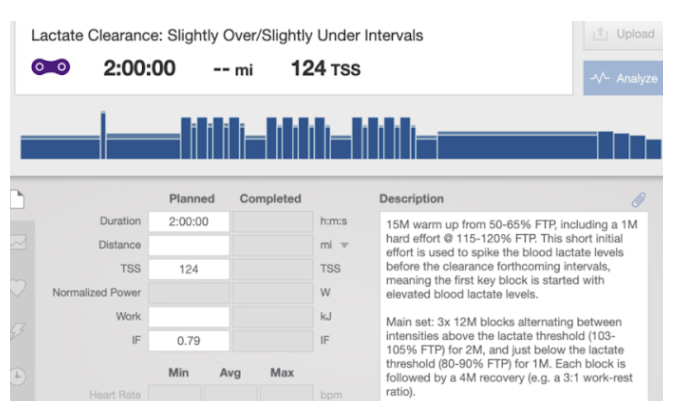
How to improve your lactate threshold as a cyclist — High North Performance
Specificity
What is prevalent now is that most of this high intensity training is done in a very specific time trial position. A 2016 study “Effect of different aerodynamic time trial cycling positions on muscle activation and crank torque” highlighted the need for specificity. These postures are required to maximize aerodynamics (44). When cyclists train there are central adaptations (heart lungs) and peripheral adaptations (specific muscles being used). Training in a specific time trial position is also often used in high intensity sessions on the road and hills. The only time that track endurance cyclists work in the upright position is when practising the start of a team pursuit or working on pure power and acceleration.
Interval Training
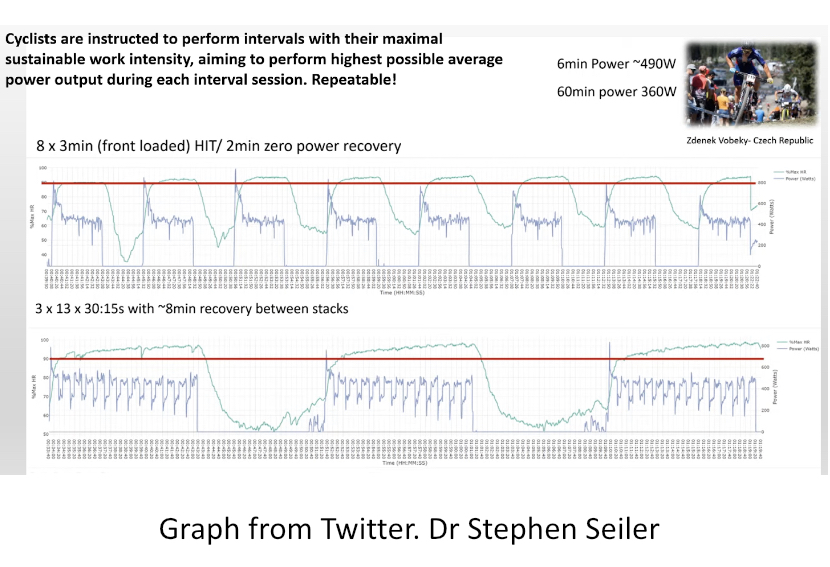
To embrace the requirements for events such as the Omnium, Interval Training has become commonplace in the training of track endurance cyclists. (21) (22). Rosenblat et al (34) attempt to categorise HIIT and SIT and investigate the efficacy of different protocols on time trial performances. Two forms of interval training commonly discussed in the literature are high-intensity interval training (HIIT) and sprint interval training (SIT). HIIT consists of repeated bouts of exercise that occur at a power output or velocity between the second ventilatory threshold and maximal oxygen consumption (VO2max). SIT is performed at a power output or velocity above those associated with VO2max. (34) Work-bouts of 120 s or less were defined as anaerobic interval (short-HIIT) for trained individuals, as the dominant source of total energy is supplied via anaerobic metabolism. For aerobic interval (long-HIIT), more than 50% of the total work completed should consist of exercise at VO2max. Therefore, long-HIIT should comprise of bouts of exercise that are at least 4 min in duration. Medium-HIIT would incorporate interval exercise that is between 2 and 4 min in duration.
Ronnestad et al (21) (22), has found superior performance improvements in elite cyclists following short-interval vs effort-matched long-interval training. Below is a graph of a 3*13*30/15 intermittent session where Heart Rate stays above 90% for most of the intervals. This makes it appropriate for Maximal Aerobic Development. But each interval is done at a higher output than if it was a longer 4, 8 or 16 minute interval. Track Endurance cycling is stochastic in nature. There are accelerations and decelerations. Stephen Seiler proposes that these intermittent intervals with short rest may provide more specific adaptations for Maximal Aerobic Development rather than longer fixed intervals.
PERIODIZATION
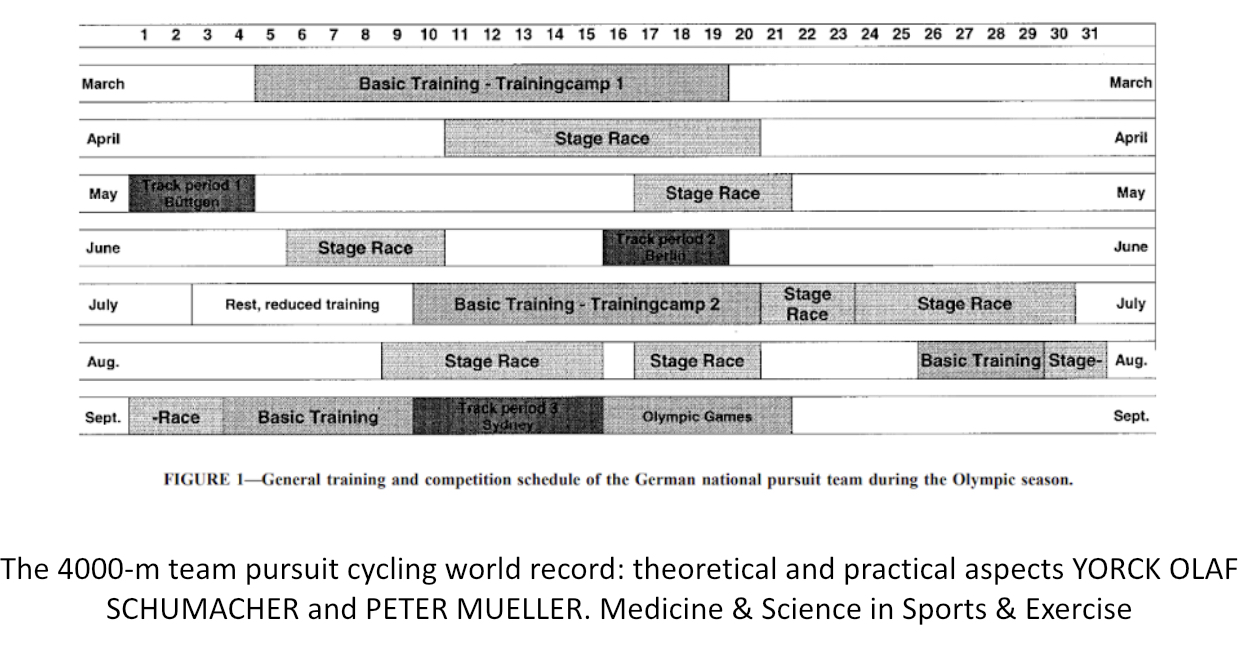
The integration of how best to develop the systems underpinning peak performance is the next challenge. Periodization models for cycling are well researched. (34) Reverse periodization models, block periodization models and pyramidal. (45). There is general agreement that the reverse periodization model tends to be used more now (35). Capacity is generally prioritized before repeatability. Often neuromuscular power is also prioritized early in a program. The polarized model then also prioritizes aerobic development. Added to this is the need to develop general strength in the gymnasium. What most elite programs now use is an interplay of blocks of training. Blocks of training may prioritize endurance and specific physiological capacities such as improving anaerobic thresholds or specific strength via hill training. Or specific Velodrome training periods with blocks of training targeting speed and power. It is difficult to find current reviews such as the 2000 review of the German Olympic Team Preparation for the 2000 Sydney Olympic Games (figure below). Nevertheless this approach is slightly different than the current Reverse Periodization models now. But once can see a double periodization model here. With road races merging into speed training in May and June. Now there is more frequent interplay between stages of Basic Training, Road races and Specific Speed Work.
The reverse periodization model targets capacity first, then alternating aerobic and speed blocks of training, so that all specific needs are developed in synergy and build upon each other sequentially. What is always retained is aerobic training strictly done within the “aerobic zones”. The key aim in aerobic training is to avoid cardiac drift at aerobic intensities. Once cardiac drift is minimized the aim is to gradually extend the distance without drifting into anaerobic zones. Strategically, but not at high volumes. work at lactate threshold intensity and maximum oxygen uptake levels is placed within a program. The practice of alternating speed phases with specific aerobic development, road races and/or hill training seemed to be the mode in the preparation for Tokyo 20217. The speed phases were generally shorter than the aerobic, road and hill training phases. Different nations used varying strategies with some employing more time at altitude for example. But strategies were generally the same. The philosophy of alternating speed and specific aerobic conditioning training blocks is prevalent. Strength training is dosed almost throughout the phases. Some more aerobically gifted cyclists do more road races. When racing obviously they lower the volume of strength training.
STRENGTH TRAINING
Strength training now underpins the development of Track Endurance Cyclists. Also core strength and postural stability. The cyclist has to maintain specific positions to enhance aerodynamics which require mobility and core strength. But pivotal to modern performances is the use of bigger gears. Given the bigger gears, the cadence numbers are less now. There is individual variation with cyclists and choice of gears. But suffice to say that strength training and the use of bigger gears are closely aligned in this era. The use of maximal strength training, unilateral training and velocity based training are all key components of the track endurance cyclists program. Also an individual approach is the key to optimally developing a cyclist. As mentioned already though, junior development usually requires skill development and the ability to operate at high cadences, before moving to bigger gears. So long term development is the key. Strength training for cycling is a vast area and I have added some references that the reader can access to learn more. (24) (25) (26)
Depending on the role in a team pursuit team or in other events, an individual approach has to be used to either maximize strength needs and complement endurance needs. The number 1 position in a team pursuit is now generally a powerful cyclist. A slightly higher emphasis on maximal strength may be required. But in cyclists in events such as the omnium or number 3 and 4 in the team pursuit teams, power/weight ratios and aerobic qualities are crucial. Whilst strength and power must still be optimized, the program must be individualized to minimize excessive weight gain. This again emphasises the individual nature of strength training in this discipline of cycling, a principle that is common to all sports.
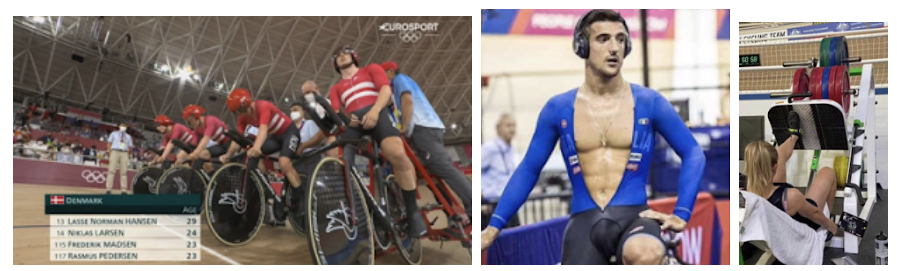
Picture 1: Denmark Team Pursuit Team Picture 2: Italian team pursuit cyclist Picture 3: Australian Team Pursuit cyclist doing single leg press.
As noted there has been a huge increase in the size of gears used since 2000. As Faria noted when a harder gear is used, type 2 muscle fibres become progressively recruited. Type 2 muscle fibres have a lower mitochondrial density than type 1 fibres (29). The cadence requirements for cyclists in events such as the Team Pursuit have plummeted. It is difficult to quantify but this change in gears and cadence has influenced the training methods and the emphasis on strength training in the sport.
Anthropometrics thus align with strength training. Lean muscle tissue must be maximized, bodyfat levels minimized. But for most track endurance cyclists, care must be taken to not increase mass too much. There is ample evidence of the anthropometrics required for road cycling, but not a lot for track endurance cycling. One key research was conducted in Australia on the female squad and highlights the low bodyfat levels in elite track endurance cyclists. (46)
Aerodynamics
Farie at el noted that from 1967 till 1996, 60% of the improvement in the 1 hour record on the velodrome came from aerodynamic advances and 40% from higher power outputs. The World 1 hour record then was 56.375. Aerodynamics is a complex field. I have added 2 references here that adequately explain the changes to cyclist, equipment and postures which are critical in gaining aerodynamic benefits. There is also a wealth of information on tactics and drafting in team pursuit races and even road races. (47) (48)
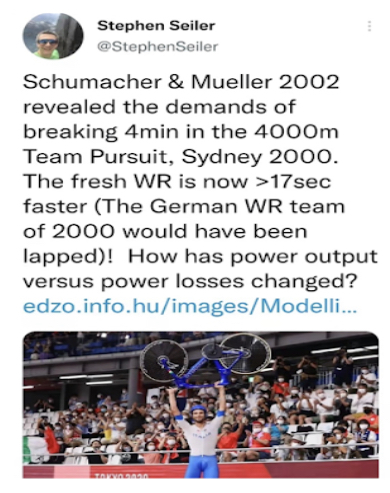
The world record is now 55.089km, and recently Dan Bigham from the UK broke Bradley Wiggins 1 hour record at sea level with 54.73km. Bigham is also an aerodynamics engineer and he made some interesting comments on social media recently. Dr Stephen Seiler posed the question. How much has power changed since 2000 when Germany won the Team Pursuit in 3:59?. Italy won in Tokyo with 3:42! Bigham did some calculations. He said there had been 25 watts increase (480 watts to 505 watts) and possibly a CdA increase of 20%. I have explained CdA later but simply put. His final comment was “aerodynamics improvements dominate”
Below are some definitions of aerodynamic terminology
- Watts = Power being produced by a rider. (
- Watts/Kilogram = more relevant on the road where there are hills and changes in surface. The higher the number here the better.
- CdA: Cd = The coefficient of drag (wind) A=How much frontal area a rider projects. (CdA is more relevant on the track). The lower the CdA the better! Small adjustments in position on the bike and equipment can lower CdA.
- Watts/CdA = Power being produced by a rider divided by the coefficient of drag multiplied by the frontal area of the cyclist. The higher the number the better! You improve both variables. Or increase Watts or decrease CdA. The big focus has been on decreasing CdA recently.
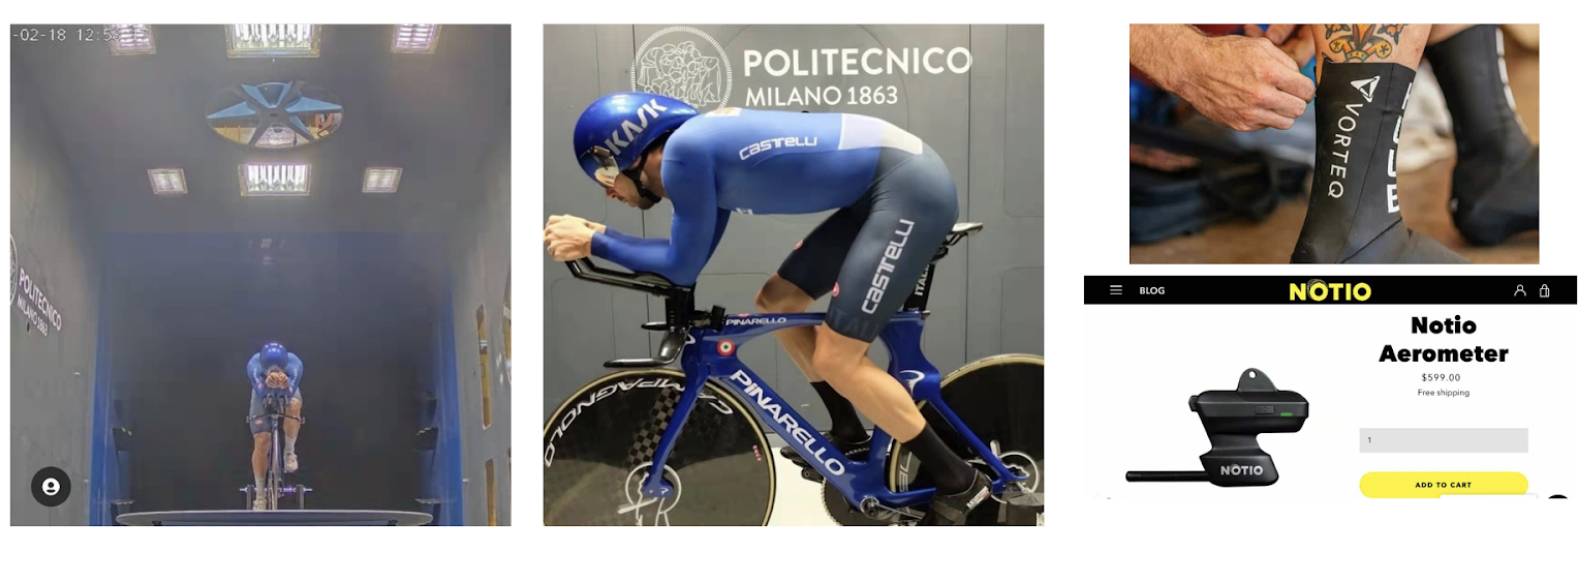
Wind Tunnels can be used to research equipment, skin tight gear and postures in an effort to get the same or extra speed with less power output. (49). But these calculations can now also be done in the field and on the velodrome with recent technology (50). Below are examples of a cyclist assessing equipment and postures in a wind tunnel. And an example of an aerometer which is now used in the field to assess aerodynamics in more specific environments.
Wind Tunnels can be used to research equipment, skin tight gear and postures in an effort to get the same or extra speed with less power output. (49). But these calculations can now also be done in the field and on the velodrome with recent technology (50). Below are examples of a cyclist assessing equipment and postures in a wind tunnel. And an example of an aerometer which is now used in the field to assess aerodynamics in more specific environments.
Gears, Training and Specificity
In 2021 bigger gears are used. The German 2000 Olympic team used a cadence of 130/135 and smaller gears. The cadence for teams in the 2021 Tokyo Olympics was well under 120. Since RIO 2016 track endurance cycling has seen a bigger emphasis on bigger gears, strength training and tactics to improve performances. (2) (29) (37) (38). Much bigger gears are now used, which changes the training required and bioenergetics of the event.
This can be attained in 3 ways 1) Weight training 2) Hill Training 3) Heavy gear or resistance bike training indoors. There is a lot of debate on the optimal method to improve specific strength on a bike. (26) (39) (40). The author’s view is that it may be individual depending on the cyclists current training age and needs. Anecdotally the current world best Track Endurance Cyclist (Filippo Ganna) said in a podcast that hill training improved his ability most to use bigger gears and thus performance. But his coach felt that resistance training in the gymnasium had been more important in this cyclist’s improvements. There is general agreement that when training specifically (hills or indoor turbo) specific Time Trial positions must be used. This is to ensure proper activation and development of specific musculature and peripheral adaptations (44). The other interesting factor is the use of the cyclists own bike on indoor turbo machines rather than products such as the Wattbike. Again this is to make the training as specific as possible.
It is outside the scope of this review to explain the complexity of how to choose gears. But gear ratios provide a guide to how big a gear is. In simple terms, a gear ratio on a bike refers to how many times the back wheel will rotate for each full turn of the crank arms (pedals). Below is the gear ratio used for the World 4 kilometre individual record set by Ashton Lambie in Mexico in September 2021. Anything above 3 is considered a big ratio. Faria et al in the Science of Cycling Part 2 provide more information factors affecting performance, amongst them, gears (30).
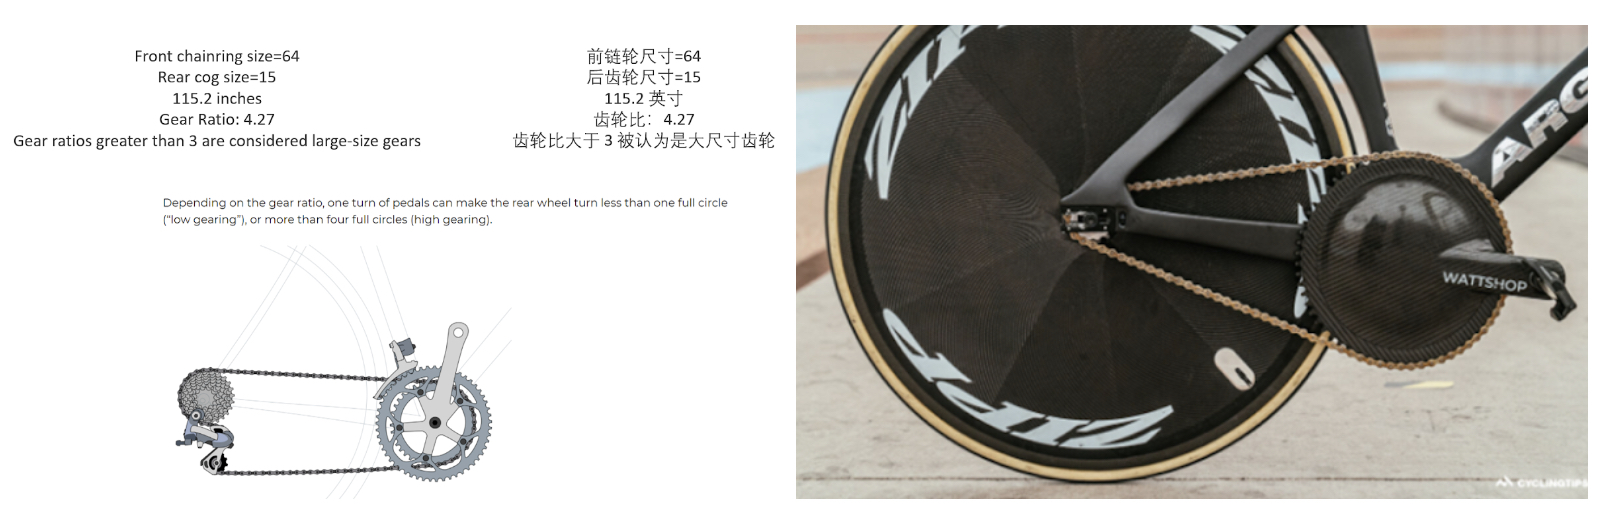
Figure () from Website: A closer look at Ashton Lambie’s $30,000 record-breaking pursuit bike | Cycling news
Specifics of Team Pursuit Races in 2021
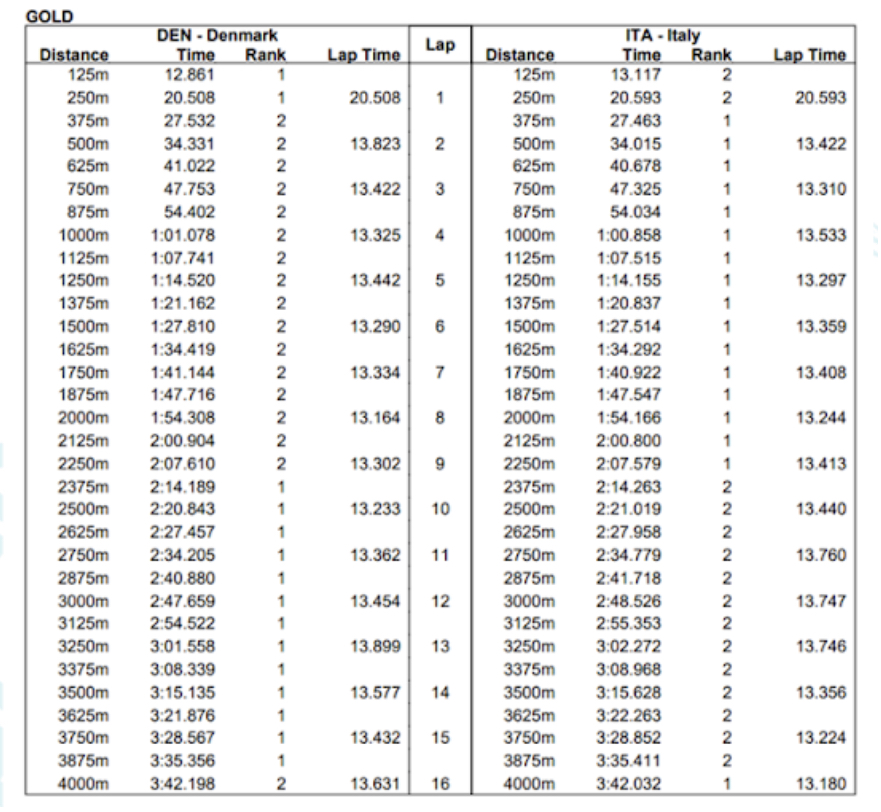
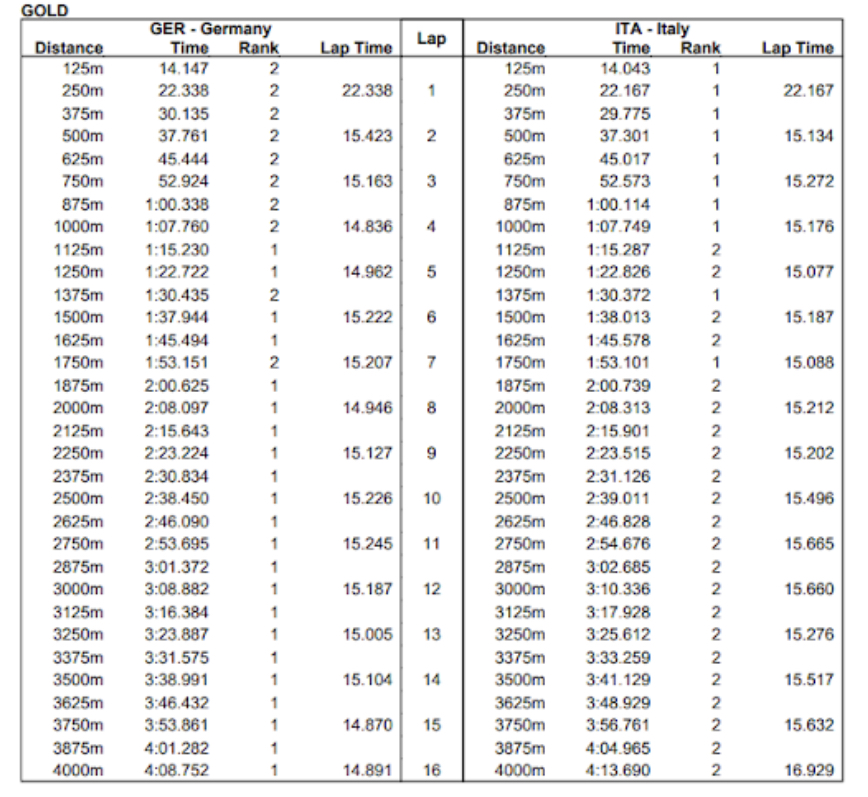
Below I have placed the results from the Men’s Tokyo Olympic Games. And the Women’s World Championships results. Germany women were faster in the Olympics with 4:04.242. But 4:08 is a better reflection of current women’s standards at elite. The Chinese National Record is 4:18 for women.
In the men’s race, one can see both teams are below 1:02 for the first kilometre. The first cyclist can often do over 2 laps now before a transition. Canada in fact did a radical experiment where they used a one kilometre specialist who stayed in front for over 4 laps then left the team.
The cyclists are using a huge amount of ATP/CP due to high power outputs in the first lap. In the men the number 1 cyclist is also often a one kilometre cyclist, some being National 1 kilometre record holders. Team Pursuit teams spend a lot of time training on their stationary start. This is to develop a faster start, but also to increase the anaerobic power reserve (55). Thus the start becomes less fatiguing. This is because there is a bigger difference between their maximal power output for 6 or 10 seconds and what their output is at the start of a team pursuit race. The less energy used at the start for faster speeds the more energy conserved for later in the race. This was highlighted in 2021 by Rasmus Lund from Denmark. In the Olympic Games he was the lead rider. Very fast 2 laps. Huge fatigue levels. He left the team at approximately 2.5 kilometres. Their time was 3:42 In the European Championships he was used as a number 3 cyclist. They had 3 junior cyclists. Their time was 3:51. But he was able to finish the 4 kilometres due to being number 3 and also the slower team time. This highlights the fatigue induced by the first few laps in team pursuit.
Teams are now using less transition. Tactics are individualized relative to the team’s individual abilities now. How long a cyclist stays in front, and who finishes a race, is determined by their physiological capacities.
The aim is for smooth acceleration at the start and getting to maximal speed as soon as possible. The term “smooth is fast” is coach talk. Lap times are as consistent as possible and little variation is required in transitions. Teams need to avoid the trap of decelerating and accelerating due to energy costs. The same principles exist in the 4 and 3 kilometre time trials. Fast start, smooth acceleration, and as little variation as possible in lap times.
Usually the most aerobically gifted cyclist finishes the race. This is when the lap times may become mor variable as noted in charts below of races. In the chart below one can observe the Italian teams last lap of 13.1, with Filippo Ganna the lead rider. He holds the World Individual 4 kilometre record and is viewed as the leading time triallist over short distances in 2021. Thus the tactics are manipulated to minimize his fatigue early In the race to allow him to lead at the end.
There have been big improvements in Track Endurance Cycling since the 2016 Olympics. Possibly more than any other sport. Hopefully this review has provided some insight into why this has occurred in such a short time span.
Charts from: Cycling Track | Tissot Timing and Home | UCI
REFERENCES
- https://www.uci.org/regulations/3MyLDDrwJCJJ0BGGOFzOat#part-iii-track-races.
- SCHUMACHER, Y. O., and P. MUELLER. The 4000-m team pursuit cycling world record: theoretical and practical aspects. Med. Sci. Sports Exerc., Vol. 34, No. 6, pp. 1029–1036, 2002.
- Craig, N. and Norton, K. Characteristics of Track Cycling. February 2001. Sports Medicine 31(7):457-68
- Stadnyk, A. M., Impellizzeri, F. M., Stanley, J., Menaspà, P., & Slattery, K. M. (2021). Testing, training, and optimising performance of track cyclists: A systematic mapping review. Sports Medicine, 1-11. https://doi.org/10.1007/ s40279-021-01565-z
- Turner, E. Munro, A. Comfort, P. Female Soccer. Part 1—A Needs Analysis Strength and Conditioning Journal: February 2013 – Volume 35 – Issue 1 – p 51-57
- Paul J. Read, Jonathan Hughes, Perry Stewart, Shyam Chavda, Chris Bishop, Mike Edwards, Anthony N. Turner. A Needs Analysis and Field-Based Testing Battery for Basketball. VOLUME 36 | NUMBER 3 | JUNE 2014. National Strength and Conditioning Association Strength and Conditioning Journal
- BROKER, J. P., C. R. KYLE, and E. R. BURKE. Racing cyclist power requirements in the 4000-m individual and team pursuits. Med. Sci. Sports Exerc. 31:1677–1685, 1999.
- Levi Heimans, Wouter R Dijkshoorn, Marco J M Hoozemans, Jos J de Koning, Optimizing the Team for Required Power During Track-Cycling Team Pursuit. Int J Sports Physiol Perform. . 2017 Nov 1;12(10):1385-1391
- Markus Wagner, Jareth Day, Diora Jordan, Trent Kroeger MIC 2011: The IX Metaheuristics International Conference S1-52–1 Evolving Pacing Strategies for Team Pursuit Track Cycling Frank Neumann School of Computer Science The University of Adelaide, SA, 5005
- The Mathematics of Breaking Away and Chasing in Cycling. Tim Olds. European Journal of Applied Physiology, 1998
- Samuel Sigrist. Thomas Maier. Raphael Faiss. Qualitative Video Analysis of Track Cycling Team Pursuit in World-Class Athletes. International Journal of Sports Physiology and Performance. 2017 Nov 1;12(10):1305-1309.
- Normand A Richard & Michael S Koehle (2018): Optimizing recovery to support multi-evening cycling competition performance, European Journal of Sport Science, DOI: 10.1080/17461391.2018.1560506.
Acute Post-Exercise Recovery Strategies in Cycling: A Review Article in Journal Of Science & Cycling · December 2018. Ryan G. Overmayer. Francisco Tavares. Matthew W Driller
- The bioenergetics of World Class Cycling. A E Jeukendrup 1, N P Craig, J A HawleyJ Sci Med Sport 2000 Dec;3(4):414-33.
- Gastin P. Energy System Interaction and Relative Contribution During Maximal Exercise. February 2001. Sports Medicine 31(10):725-41
- 5. Medbo JI, Mohn AC, Tabata I, Bahr R, Vaage O, Sejersted OM. Anaerobic capacity determined by maximal accumulated O2 deficit. J Appl Physiol. 1988;64:50–60.
- EANNA McGRATH†, NICK MAHONY‡, NEIL FLEMING‡ and BERNARD DONNE‡Is the FTP Test a Reliable, Reproducible and Functional Assessment Tool in Highly-Trained Athletes?International Journal of Exercise Science 12(4): 1334-1345, 2019.
- Owen Jeffries 1, Richard Simmons 2, Stephen D Patterson 2, Mark Waldron 2 3. J Strength Cond Res. 2021 Oct 1;35(10):2790-2794.. Functional Threshold Power Is Not Equivalent to Lactate Parameters in Trained Cyclists
- Influence of All-Out and Fast Start on 5-min Cycling Time Trial Performance. September 2009. Medicine and Science in Sports and Exercise 41(10):1965-71. Brad Aisbett. Peter Lerossignol. Glenn K Mcconell. Rodney J Snow
- Sports (Basel) 2020 Sep 4;8(9):123.The Application of Critical Power, the Work Capacity above Critical Power (W’), and its Reconstitution: A Narrative Review of Current Evidence and Implications for Cycling Training Prescription. Alan Chorley 1, Kevin L Lamb 1
- Eur J Appl Physiol. 2021 Oct 27. Power profiling and the power-duration relationship in cycling: a narrative review. Peter Leo 1, James Spragg 2, Tim Podlogar 3 4, Justin S Lawley 5, Iñigo Mujika 6 7
- Scand J Med Sci Sports. 2020 May;30(5):849-857. Superior performance improvements in elite cyclists following short-interval vs effort-matched long-interval training. Bent R Rønnestad 1, Joar Hansen 1, Håvard Nygaard 1, Carsten Lundby 1
- Scand J Med Sci Sports 2015: 25: 143–151.Short intervals induce superior training adaptations compared with long intervals in cyclists – An effort-matched approach B. R. Rønnestad1 , J. Hansen1 , G. Vegge1 , E. Tønnessen2 , G. Slettaløkken1
- Int J Sports Physiol Perform. 2010 Sep;5(3):276-91.What is best practice for training intensity and duration distribution in endurance athletes?Stephen Seiler 1
- The anaerobic threshold: 50+ years of controversy. The journal of physiology. David C. Poole, Harry B. Rossiter, George A. Brooks, L. Bruce Gladden ages: 737-767
- 1. Rønnestad, B.R.; Hansen, E.A.; Raastad, T. Effect of heavy strength training on thigh muscle cross-sectional area, performance determinants, and performance in well-trained cyclists. Eur. J. Appl. Physiol. 2010, 108, 965–975. [CrossRef] [PubMed]
- Vikmoen, O.; Ellefsen, S.; Trøen, Ø.; Hollan, I.; Hanestadhaugen, M.; Raastad, T.; Rønnestad, B.R. Strength training improves cycling performance, fractional utilization of VO2max and cycling economy in female cyclists. Scand. J. Med. Sci. Sports 2016, 26, 384–396. [CrossRef] [PubMed]
- Aagaard, P.; Andersen, J.L.; Bennekou, M.; Larsson, B.; Olesen, J.L.; Crameri, R.; Magnusson, S.P.; Kjaer, M. Effects of resistance training on endurance capacity and muscle fiber composition in young top-level cyclists. Scand. J. Med. Sci. Sports 2011, 21, e298–e307. [CrossRef
- Med Sci Sports Exerc. 2004 Apr;36(4):674-88. Fundamentals of resistance training: progression and exercise prescription. William J Kraemer 1, Nicholas A Ratamess
- Sports Med. 2005;35(4):285-312.. The science of cycling: physiology and training – part 1. Erik W Faria 1, Daryl L Parker, Irvin E Faria
- The Science of Cycling Factors Affecting Performance – Part 2 Erik W. Faria, 1 Daryl L. Parker and Irvin E. Faria. Sports Med 2005; 35 (4): 313-337
- Front Physiol. 2014 Feb 4;5:33. Polarized training has greater impact on key endurance variables than threshold, high intensity, or high volume training. Thomas Stöggl 1, Billy Sperlich 2
- Int J Environ Res Public Health. 2021 Jun; 18(12): 6547.
- The Effect of Polarized Training (SIT, HIIT, and ET) on Muscle Thickness and Anaerobic Power in Trained Cyclists. 2021 Jun; 18(12): 6547.Paulina Hebisz* and Rafał Hebisz. Joseph Marino,
- Polarized vs. Threshold Training Intensity Distribution on Endurance Sport Performance: A Systematic Review and Meta-Analysis of Randomized Controlled Trials. May 2018. The Journal of Strength and Conditioning Research 33(12):1. Michael A Rosenblat. Andrew S. Perrotta. Bill Vicenzino
- Sports Medicine (2020) 50:1145–1161 https://doi.org/10.1007/s40279-020-01264-1 SYSTEMATIC REVIEW Efect of High-Intensity Interval Training Versus Sprint Interval Training on Time-Trial Performance: A Systematic Review and Meta-analysis Michael A. Rosenblat1,3 · Andrew S. Perrotta2 · Scott G. Thomas1,
- The training intensity distribution among well-trained and elite endurance athletes. Thomas L. Stöggl1* and Billy Sperlich2. Front. Physiol., 27 October 2015. Volume 6. Article 2
- Effectiveness of Reverse vs. Traditional Linear Training Periodization in Triathlon. August 2019. International Journal of Environmental Research and Public Health 16(15):2807. Vicente Javier Clemente-Suárez. Domingo Jesús Ramos-Campo
- Ernst A Hansen, Bent R Rønnestad. Int J Sports Physiol Perform. 2017 Oct;12(9):1127-1136. Effects of Cycling Training at Imposed Low Cadences: A Systematic Review
- Adrien Mater 1, Pierre Clos 1, Romuald Lepers . Int J Environ Res Public Health. 2021 Jul 26;18(15):7912.Effect of Cycling Cadence on Neuromuscular Function: A Systematic Review of Acute and Chronic Alterations
- Carl D Paton 1, Will G Hopkins, Christian Cook. J Strength Cond Res. 2009 Sep;23(6):1758-63. Effects of low- vs. high-cadence interval training on cycling performance
- Ernst A Hansen, Bent R Rønnestad. Int J Sports Physiol Perform. 2017 Oct;12(9):1127-1136. Effects of Cycling Training at Imposed Low Cadences: A Systematic Review
- Mark Glaister 1, Michael H Stone, Andrew M Stewart, Michael G Hughes, Gavin L Moir. J Strength Cond Res. 2007 May;21(2):606-12.. The influence of endurance training on multiple sprint cycling performance
- J Physiol 586.1 (2008) pp 35–44 35 TOPICAL REVIEW Endurance exercise performance: the physiology of champions Michael J. Joyner1 and Edward F. Coyle2
- Vanhatalo, A., Jones, A. M., & Burnley, M. (2011). Application of critical power in sport. International journal of sports physiology and performance, 6(1), 128-136.
- Scand J Med Sci Sports. 2016 May;26(5):528-34.. Effect of different aerodynamic time trial cycling positions on muscle activation and crank torque. D M Fintelman 1, M Sterling 2, H Hemida 2, F-X Li 1
- Effects of 12 weeks of block periodization on performance and performance indices in well-trained cyclists B. R. Rønnestad1 , S. Ellefsen1 , H. Nygaard1 , E. E. Zacharoff1 , O. Vikmoen1 , J. Hansen1 , J. Hallén2. Scand J Med Sci Sports 2014: 24: 327–
- Eur J Sport Sci. 2016 Sep;16(6):645-53. Body composition of female road and track endurance cyclists: Normative values and typical changes. Eric C Haakonssen 1 2 3, Martin Barras 2, Louise M Burke 4 5, David G Jenkins 3, David T Martin 1
- Sports Med. 2005;35(4):313-37. The science of cycling: factors affecting performance – part 2. Erik W Faria 1, Daryl L Parker, Irvin E Faria
- Journal of Wind Engineering and Industrial Aerodynamics. Volume 214, July 2021, 104673. Cyclist aerodynamics through time: Better, faster, stronger. FabioMaliziaabBertBlockenab
- Riding against the wind: a review of competition cycling aerodynamics. Timothy N. Crouch, David Burton, Zach A. LaBry & Kim B. Blair .Sports Engineering volume 20, pages81–110 (2017)
- Eur J Sport Sci. 2021 Mar 8;1-6. Reliability and sensitivity of the Notio Konect to quantify coefficient of drag area in elite track cyclists. Mehdi Kordi 1 2, Gert Galis 3, Teun van Erp 4, Wouter Terra 3
- Olympic Sports – How Does Peak Age Vary? – The Stats Zone
- World Pursuit Champ Ashton Lambie Gets PEZ’d! – PezCycling News
- H. Allen and A. Coggan. 2010. Training and Racing with a power meter. 2nd Edition (Boulder, CO: Velo Press).
- The anaerobic power reserve and its applicability in professional road cycling. October 2018. Journal of Sports Sciences 37(3):1-9. Dajo Sanders. Mathieu Heijboer
